Trial field execution is the operational side of running an agricultural field trial. It is everything between a scientific question and a dataset: laying out plots, assigning treatments and replicates, performing the right application on the right plot on the right day, and capturing observations in a structure that supports analysis at the end of the season.
Good trial field execution is not improvisation. It is the disciplined translation of a trial plan into physical operations in a field. When execution is sloppy — treatments applied to the wrong plot, a spray missed on one block, dates drifting because someone didn't know the schedule — the statistical power of the trial collapses, and the whole season of work produces a result nobody can trust.
This article walks through what trial field execution actually involves, the core concepts (plots, treatments, moments, replicates), the workflow most research teams follow, and how software like FarmDataViewer structures that workflow so the plan and the field match up at every step.
Definition
Trial field execution is the process of realising a trial plan on a real piece of land: drawing the plots, assigning treatments to plots through randomisation, carrying out each scheduled treatment and observation, and documenting what actually happened per plot and per moment.
The execution layer sits on top of the experimental design (what should happen) and produces the dataset (what did happen). Both sides are equally important. A perfect design that is executed badly yields unusable data; impeccable execution of a bad design answers the wrong question.
Why Structured Trial Execution Matters
In commercial farming, mistakes in field operations are expensive but recoverable. In a trial, mistakes destroy statistical comparability. The core reasons to structure trial field execution carefully:
- Separating treatment effects from field variability. Replicates and spatial randomisation neutralise soil gradients, headland effects, and other confounders. They only work if the randomised assignment is preserved in the field.
- Timing. Treatments must be applied on the dates the plan specifies, within the growth stage the trial targets. Missing a spray window invalidates a row in your results.
- Traceability. Regulators, clients, and peer reviewers expect to see what was applied, where, and when — per plot, not just per field.
- Reproducibility. Another researcher should be able to read the plan and repeat it. That requires a seed for randomisation, structured treatment definitions, and a record of every task.
Core Concepts: Plots, Treatments, Moments, Replicates
Trial field execution rests on four entities that show up in every serious trial management system.
- Plot — a physical rectangle of land with a known geometry and coordinates. Plots are what you walk to, spray, sample, or harvest. Typical plot dimensions are given by the trial protocol (for example 10 m × 4 m).
- Treatment — a condition being tested: a spray programme, a fertiliser rate, a variety, or an untreated control. Treatments are usually coded with letters or numbers (A, B, C…) so they can be written on stakes and referenced in tasks.
- Moment — an activity date. Treatments are not applied once; they are applied on a schedule. T1 might be a pre-emergence herbicide, T2 a first fungicide, T3 a second fungicide, and so on. Moments define when something happens, while treatments define what happens.
- Replicate — each treatment is repeated in multiple plots to dampen the influence of within-field variability. Four to six replicates is typical; more for low-effect treatments or noisy fields.
A trial plan is effectively a three-dimensional structure: the treatment × moment matrix (what to apply when) is overlaid with the plot × replicate geometry (where each treatment physically sits).
The Trial Execution Workflow
Most research teams follow a similar workflow, whether the trial is run by a crop protection company at a dedicated trial site or by a farmer comparing varieties on-farm.
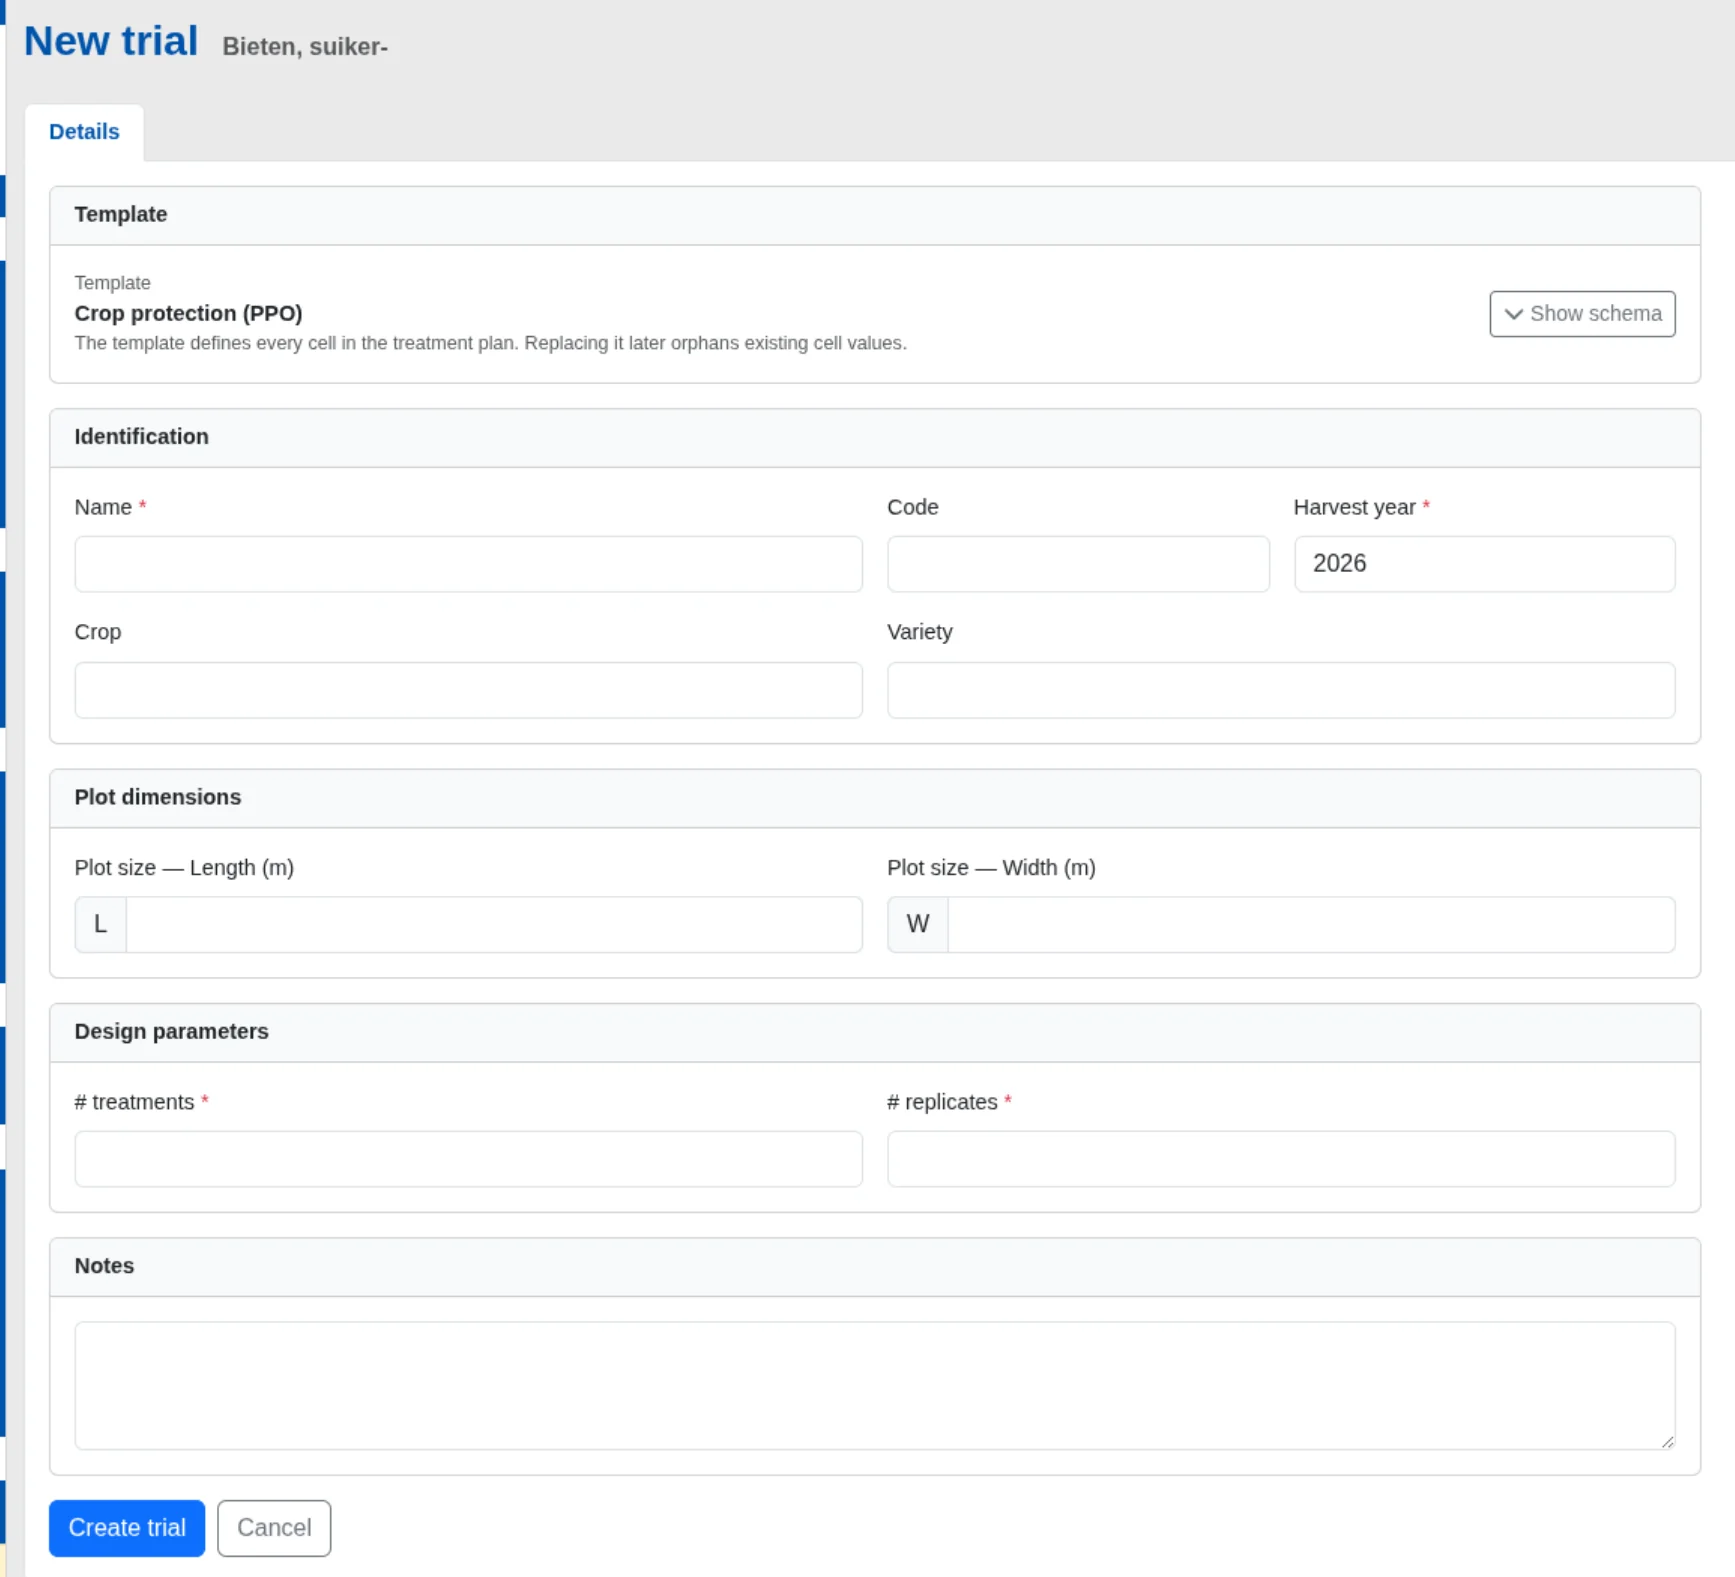
1. Define the trial
Pick a field, a crop, a harvest year, and the plot dimensions. Pick the number of treatments and the number of replicates. Load a template if the organisation has standardised trial types (a crop protection template, a fertiliser rate template, etc.).
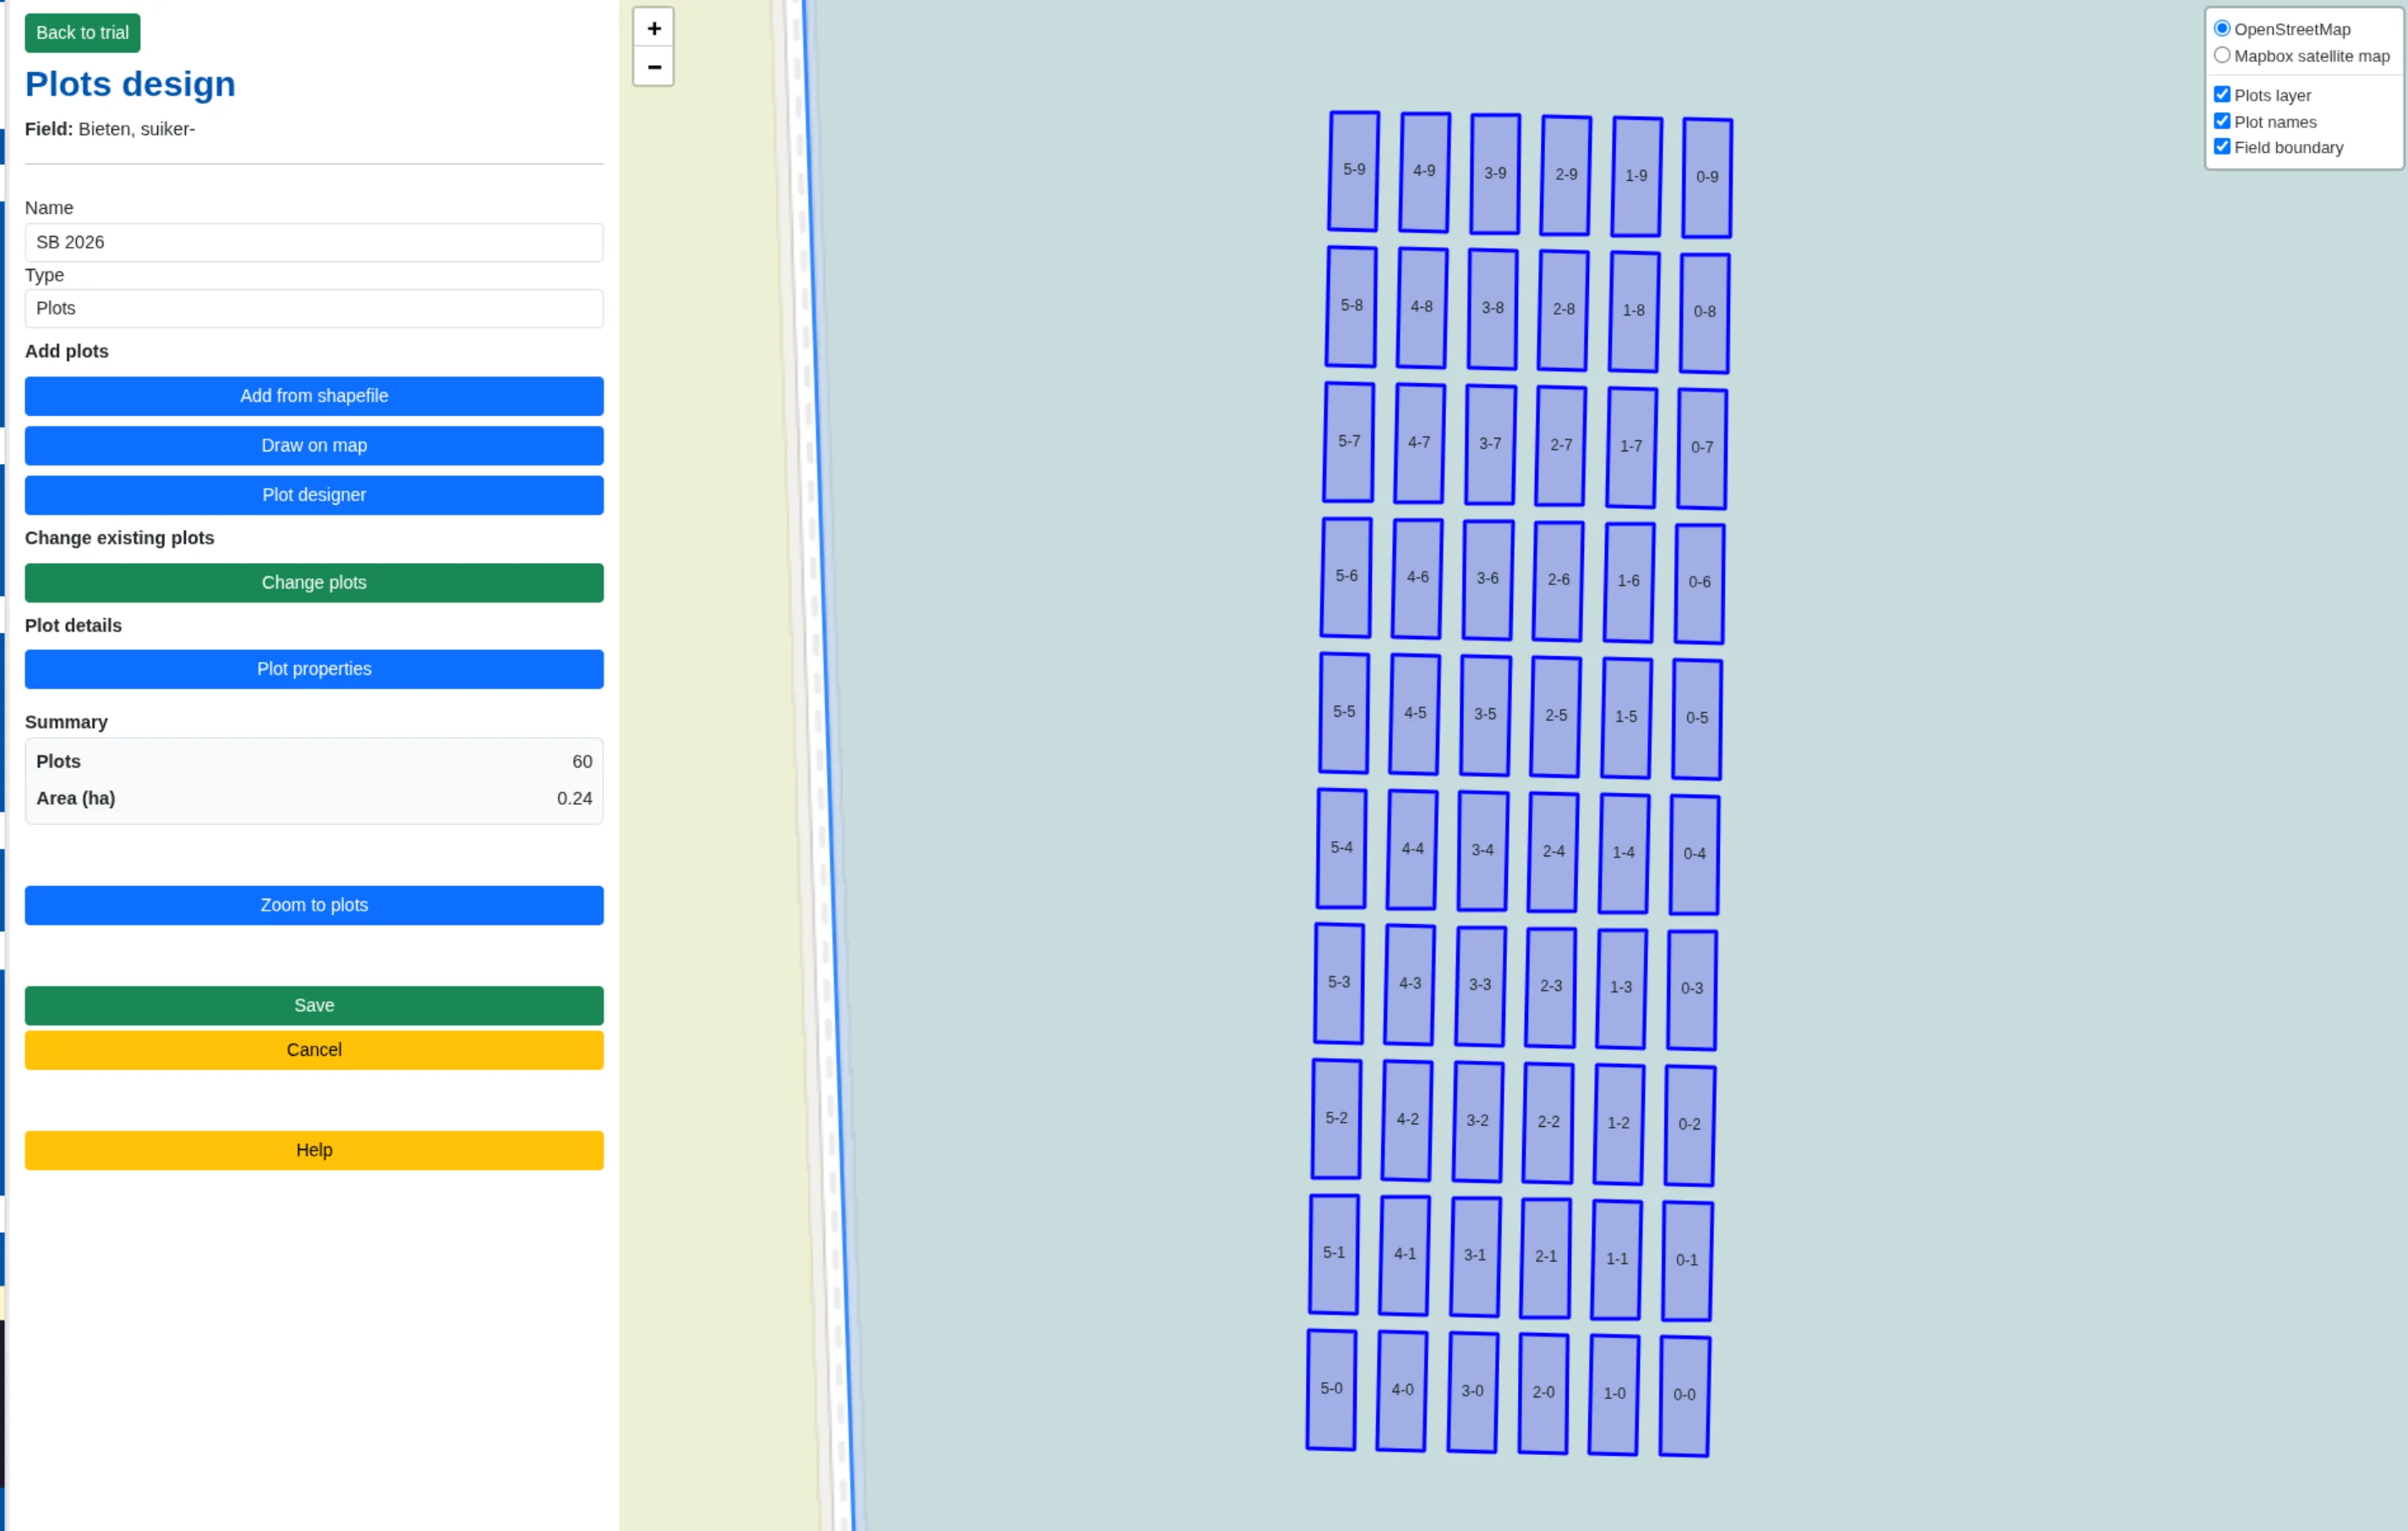
2. Lay out the plots
Plot geometry can be drawn on the map, generated from a parametric grid, or imported from a shapefile if the plot corners were measured in the field. Plots are labelled with a coordinate (for example 3-2 for column 3, row 2) so each one can be referenced unambiguously on a stake and in a task list.
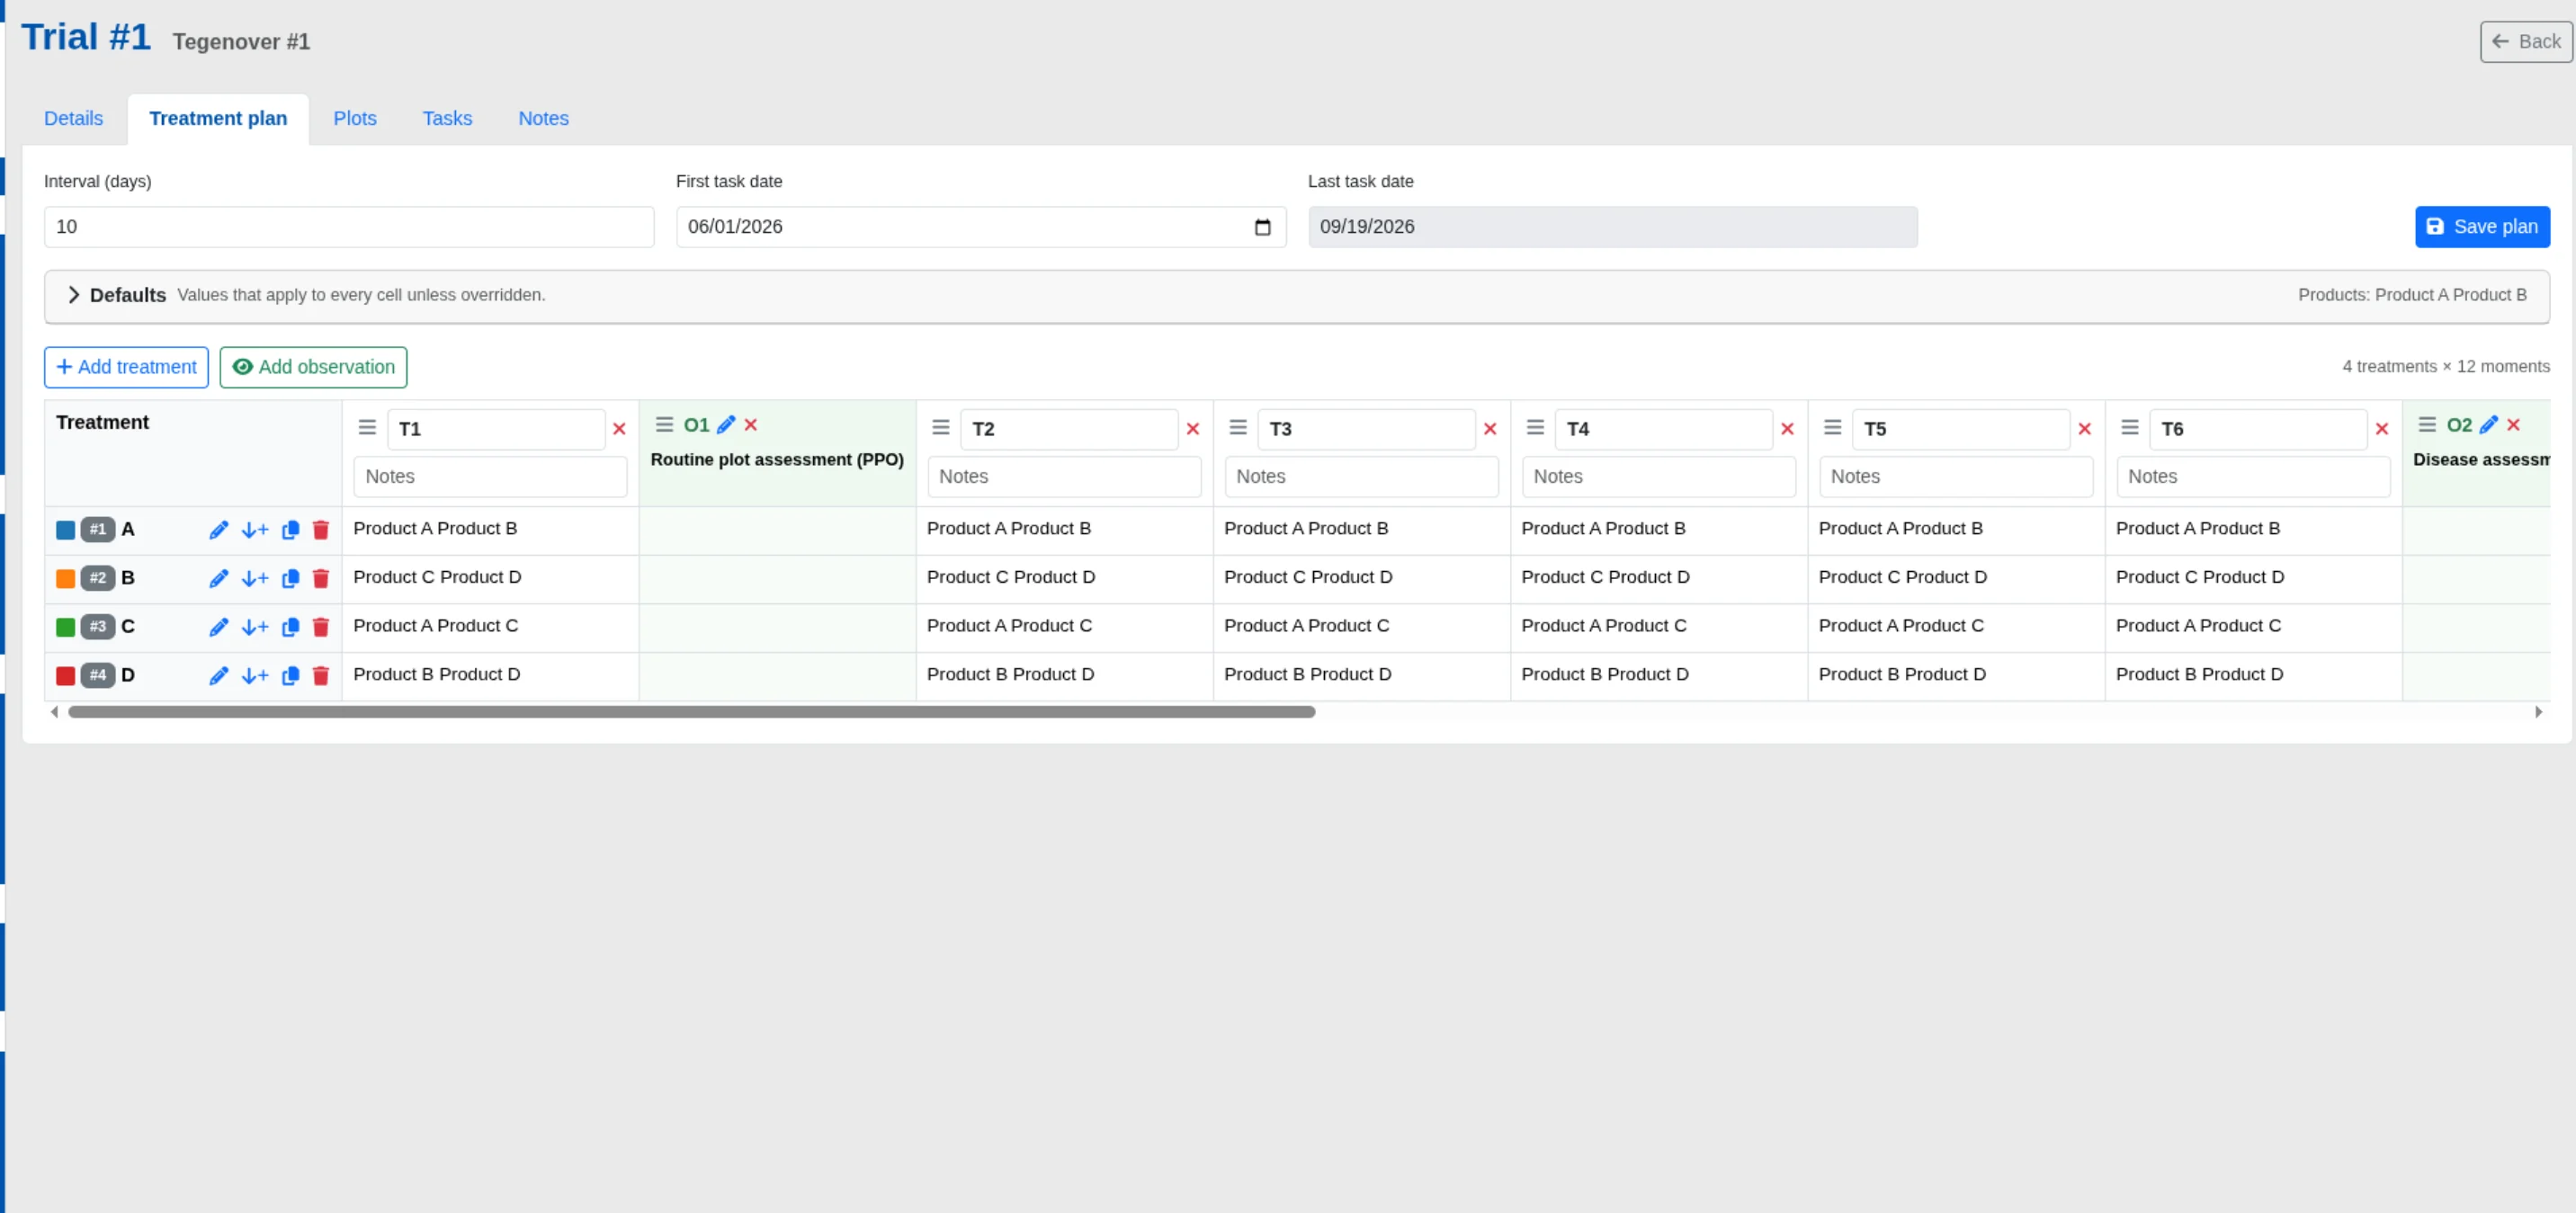
3. Design the treatment plan
The treatment plan is an X × Y matrix. Columns are moments (T1, T2, T3…); rows are treatments (A, B, C, D…). Each cell describes what is applied in that treatment at that moment — a product, a rate, a mix. Observation moments sit in the same matrix and describe what is measured at that date (ratings, photos, counts).
4. Randomise replicates
Randomisation assigns the treatment × replicate combinations to physical plots. Simple random allocation is usually not good enough; agricultural trials use designs like the Randomised Complete Block Design (RCBD) or Latin Rectangle to balance treatments against spatial gradients. The randomisation is seeded so the assignment can be reproduced and audited.
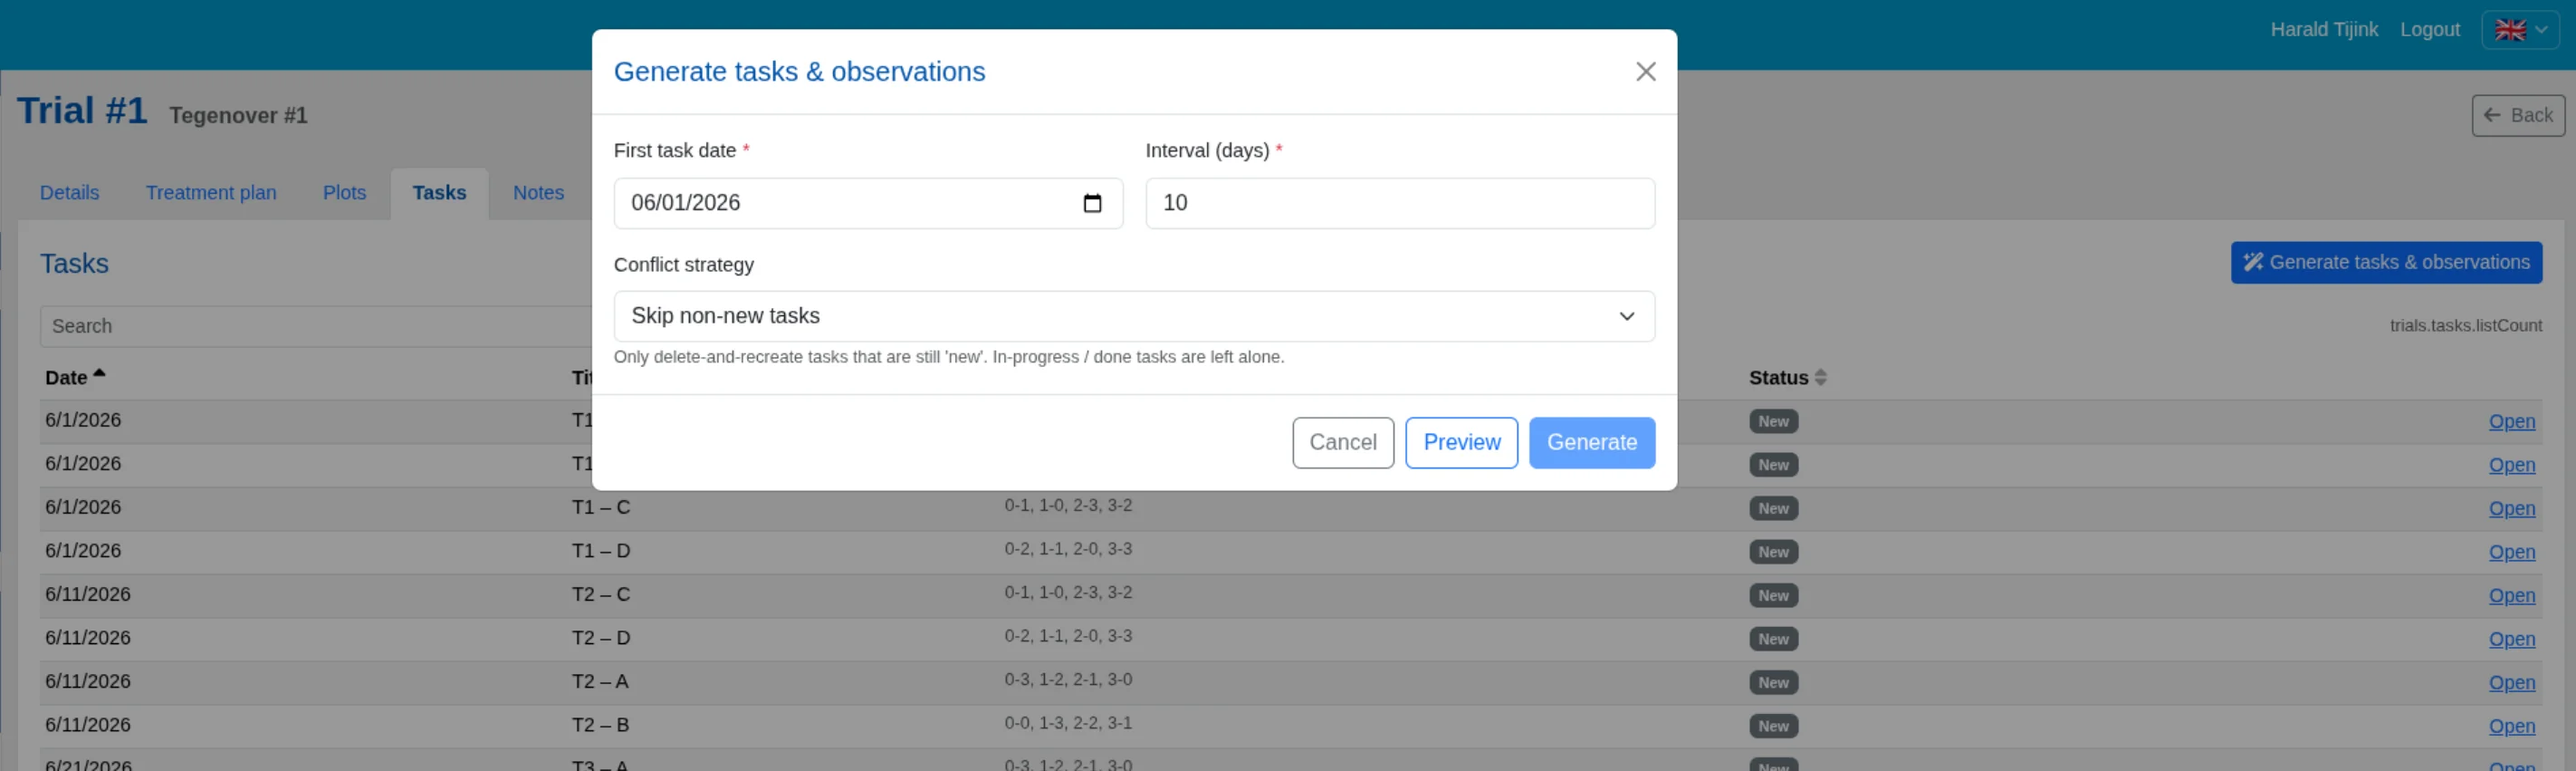
5. Generate tasks
From the plan plus the plot assignment, the system generates a task for every (moment × treatment) pair, linked to the plots assigned that treatment. Each task inherits the merged recipe from the plan defaults plus the specific cell in the matrix. Dates are derived from a first-task date plus a moment interval.
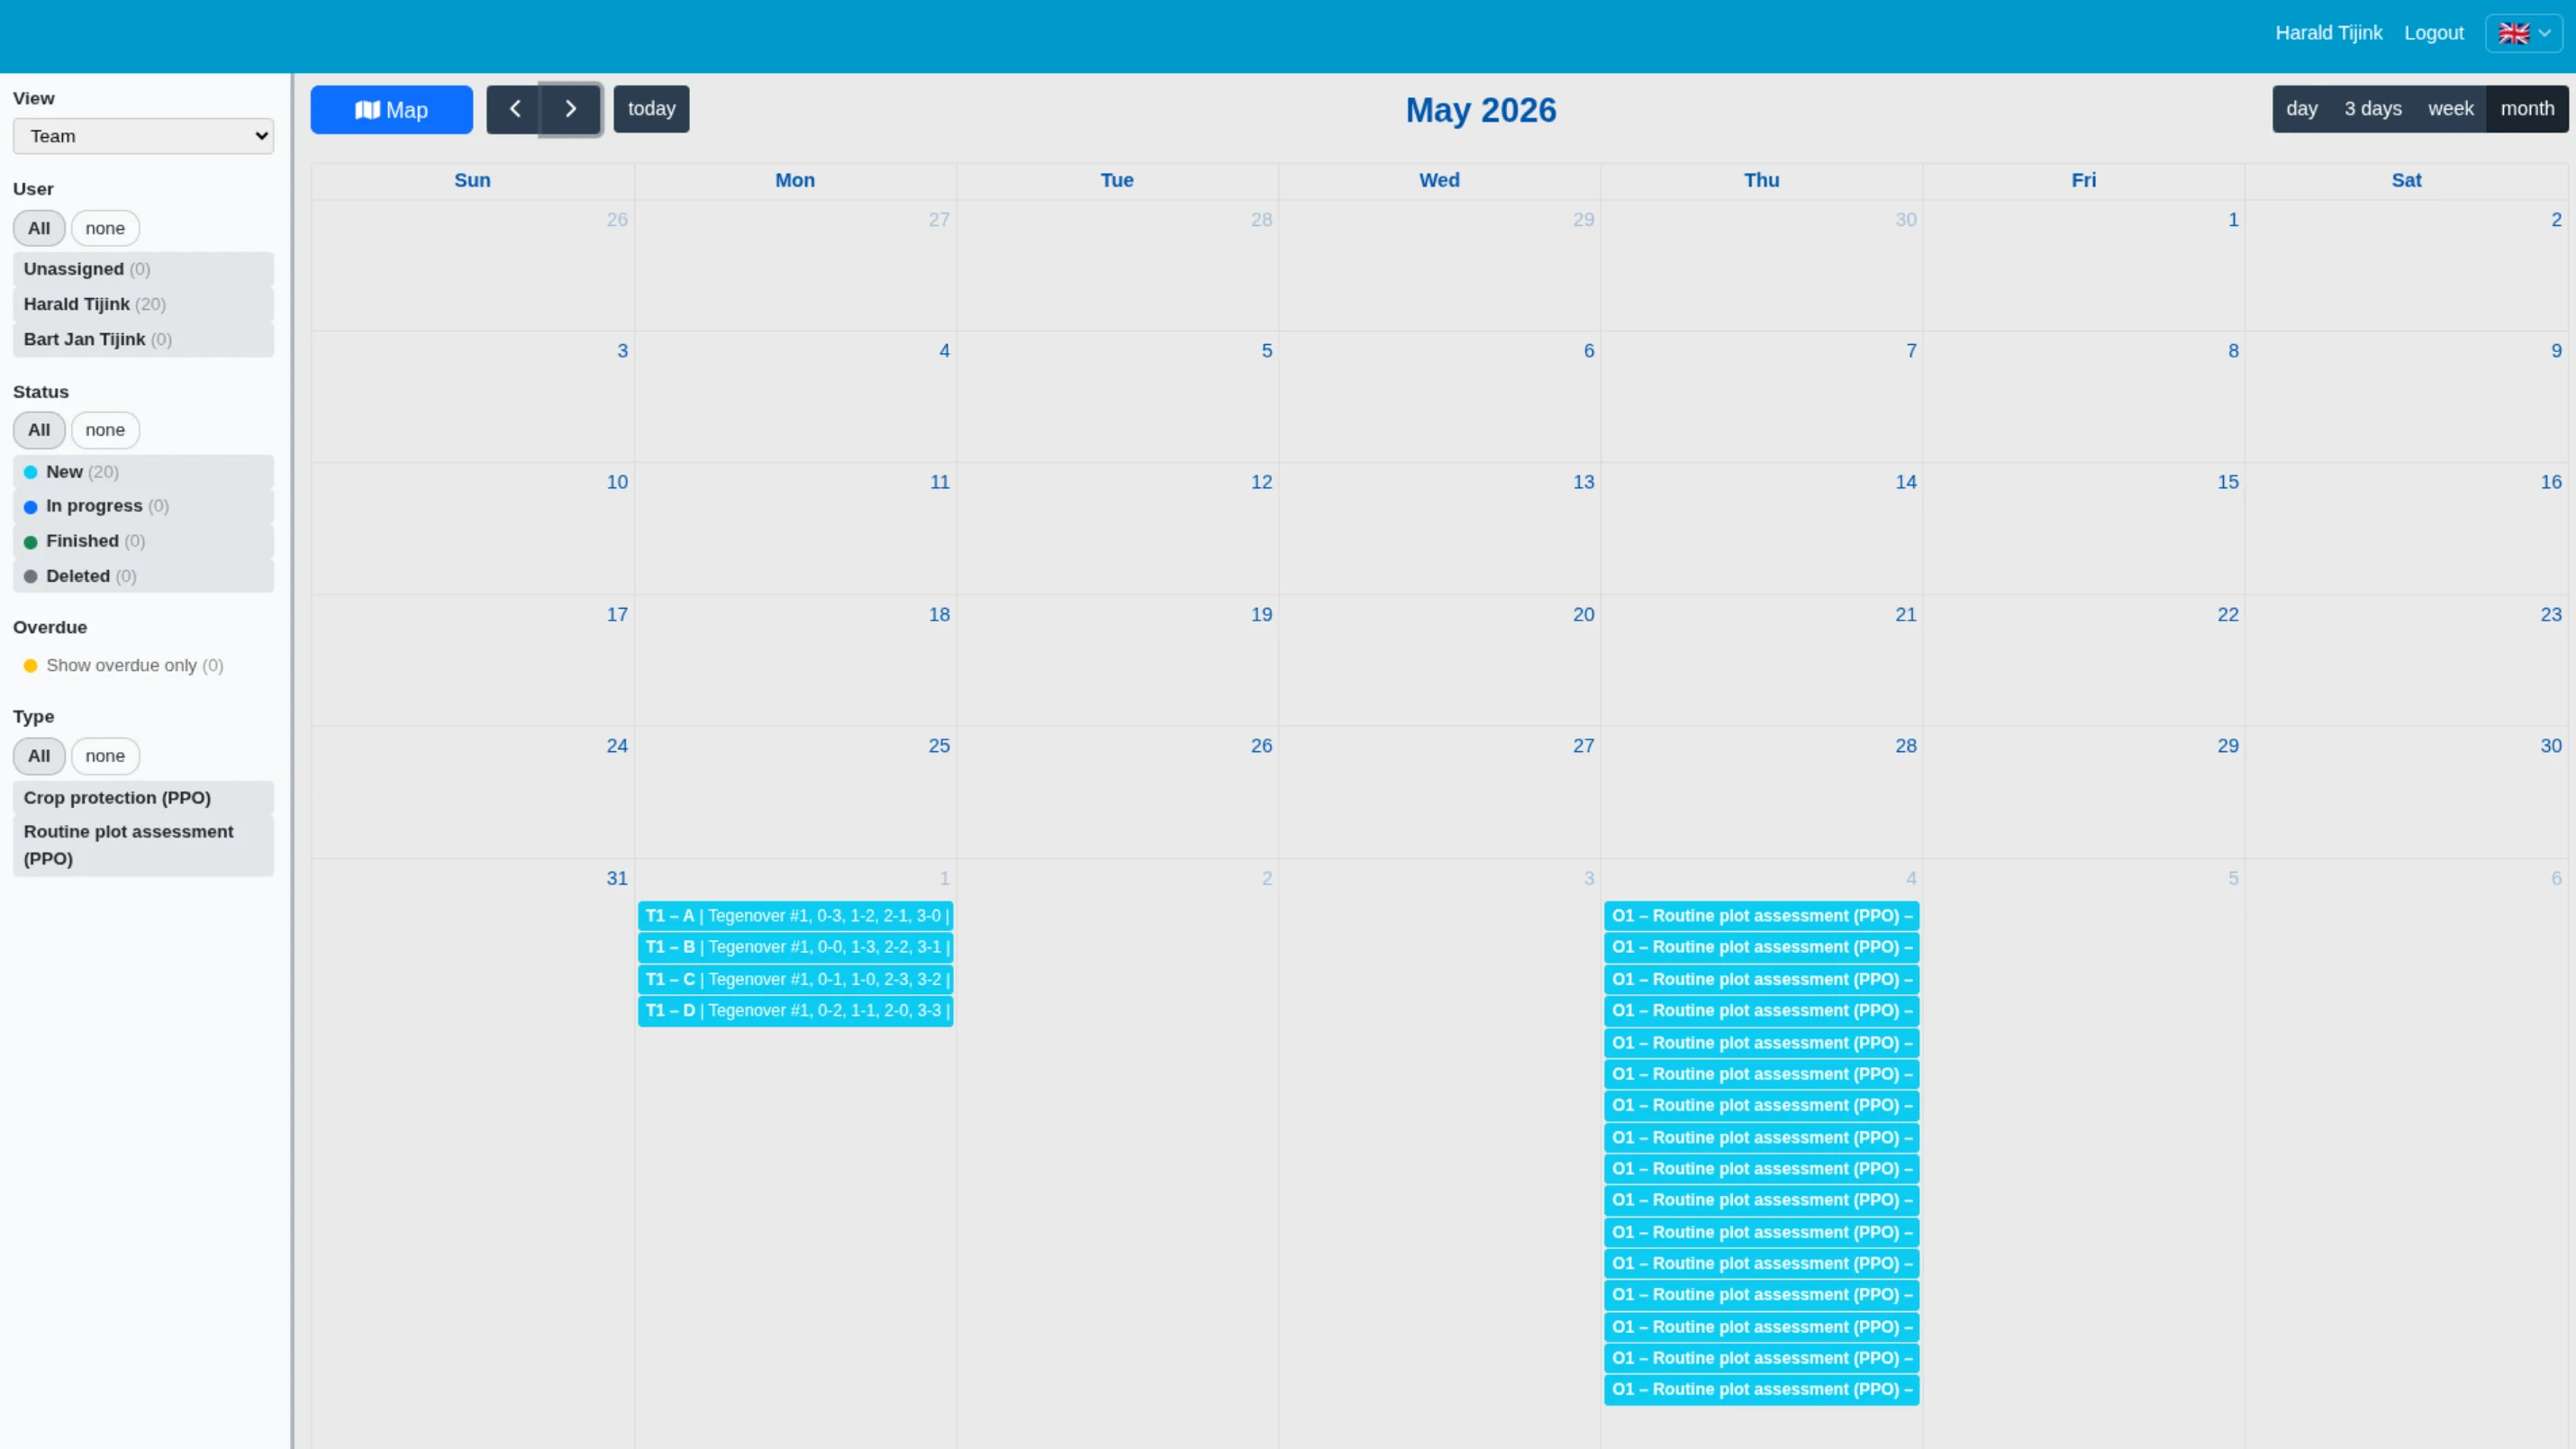
6. Execute in the field
The people actually doing the work — spray operators, scouts, harvest crews — work from a calendar or task list, not from the planning matrix. They open the task, see the plots and the recipe, apply the treatment, and mark the task done. Observations are captured per plot with photos, GPS, and any measurements the trial requires.
7. Document and report
During and after the trial, the system aggregates what was done into reports: the required-products report sums inputs across the whole trial for procurement; printable plot labels identify plots physically in the field; observations become the raw data for analysis.
Experimental Design in One Page
Execution is only as good as the design it serves. A short checklist for researchers and agronomists picking a design:
| Design | When to use |
|---|---|
| Randomised Complete Block Design (RCBD) | One gradient to protect against (soil, slope); all treatments fit in a block. |
| Latin Rectangle / Latin Square | Two gradients to protect against simultaneously (for example, soil and direction of spraying). |
| Split-plot | One factor is hard to change on small plots (tillage, irrigation); others are nested inside. |
| Augmented design | Many test treatments, few replicates; a shared set of checks is replicated to estimate field variability. |
| α-designs and resolvable incomplete blocks | Large treatment sets where full blocks become too large for field conditions. |
Whichever design is chosen, execution needs to preserve the structure on the ground — that is what separates a clean result from a noisy one.
FarmDataViewer's randomisation engine currently implements the Latin Rectangle design with a reproducible seed. Balanced layouts (where plots-per-strip matches the number of treatments) use a greedy Latin-rectangle fill; unbalanced layouts fall back to a balanced-pool walk that avoids adjacent repeats. Support for additional designs (RCBD, split-plot, augmented) is on the roadmap — contact us if you need a specific design for your trial programme.
From Plan to Field: Task Generation
The translation from plan to tasks is the single most error-prone step in manual trial management. Spreadsheets drift; stake labels fade; a spray operator applies T2 to the wrong replicate.
Generating tasks from a structured plan removes the interpretation step. Each task carries:
- The date, derived from the first-task date plus the moment interval
- The plots to apply it on, merged to a single task for efficient operation
- The recipe for that (moment, treatment) pair, merged from the plan defaults and the specific cell
- A link back to the trial, so the result can be attributed to the plan
If the plan changes (a cell is edited, a moment is added), tasks can be regenerated. A conflict strategy prevents overwriting tasks that are already in progress or done.
Documenting the Trial: Labels, Reports, Observations
Trial field execution is not just doing the work; it is documenting it in a way that survives past the season.
- Plot labels — printable stakes showing the plot coordinate and treatment code, so anyone walking the trial can orient themselves.
- Required-products report — total volumes of each product needed across the whole plan, calculated from plot areas and application rates. Essential for procurement and for biocide regulations.
- Observations — the actual dataset, captured per plot on scheduled observation moments. Observations attach to the trial, so they can be retrieved, exported, and analysed.
Common Questions About Trial Field Execution
What is trial field execution?
Trial field execution is the operational side of running an agricultural field trial: laying out plots, assigning treatments and replicates, executing the planned applications and observations on the right dates, and capturing the results per plot and per moment.
What does a trial plan contain?
A trial plan contains the plot geometry, the treatments, the application and observation moments, the replicate count, plot size, and the randomisation rule that maps treatments to physical plots.
Why are replicates and randomisation important?
Replicates and randomisation separate the effect of the treatment from within-field variability such as soil gradients and headland effects. Without them, the apparent treatment effect may just be noise.
How are tasks generated from a trial plan?
For every combination of moment and treatment, a task is created, linked to the plots assigned that treatment. The task inherits its recipe from the plan defaults merged with the specific cell in the matrix; the date is derived from the first-task date plus the moment interval.
What outputs does a trial produce during execution?
During execution, a trial produces task completion records, observation data per plot, printable plot labels, and a required-products report summing inputs across the whole plan.
Managing Trial Field Execution with FarmDataViewer
FarmDataViewer supports the whole trial execution workflow in one platform. The Field Trials feature contains a plot designer, a treatment plan matrix editor, seeded Latin Rectangle randomisation, automatic task generation, a map coloured by treatment, printable plot labels, and a required-products report.
The plan and the field stay connected: editing a cell updates the underlying tasks; completing a task updates the trial status; observations captured in the mobile app land on the right plot and moment automatically.
Conclusion
Good trial field execution is what turns a scientific question into a dataset worth reading. It is disciplined, concrete, and unglamorous — and when the right tooling is in place, it stops being a source of stress and starts being a source of confidence in the numbers.
If you run field trials and want to see how FarmDataViewer structures the whole workflow from plot layout to required-products report, request a demo. We'll walk through a real trial with you.