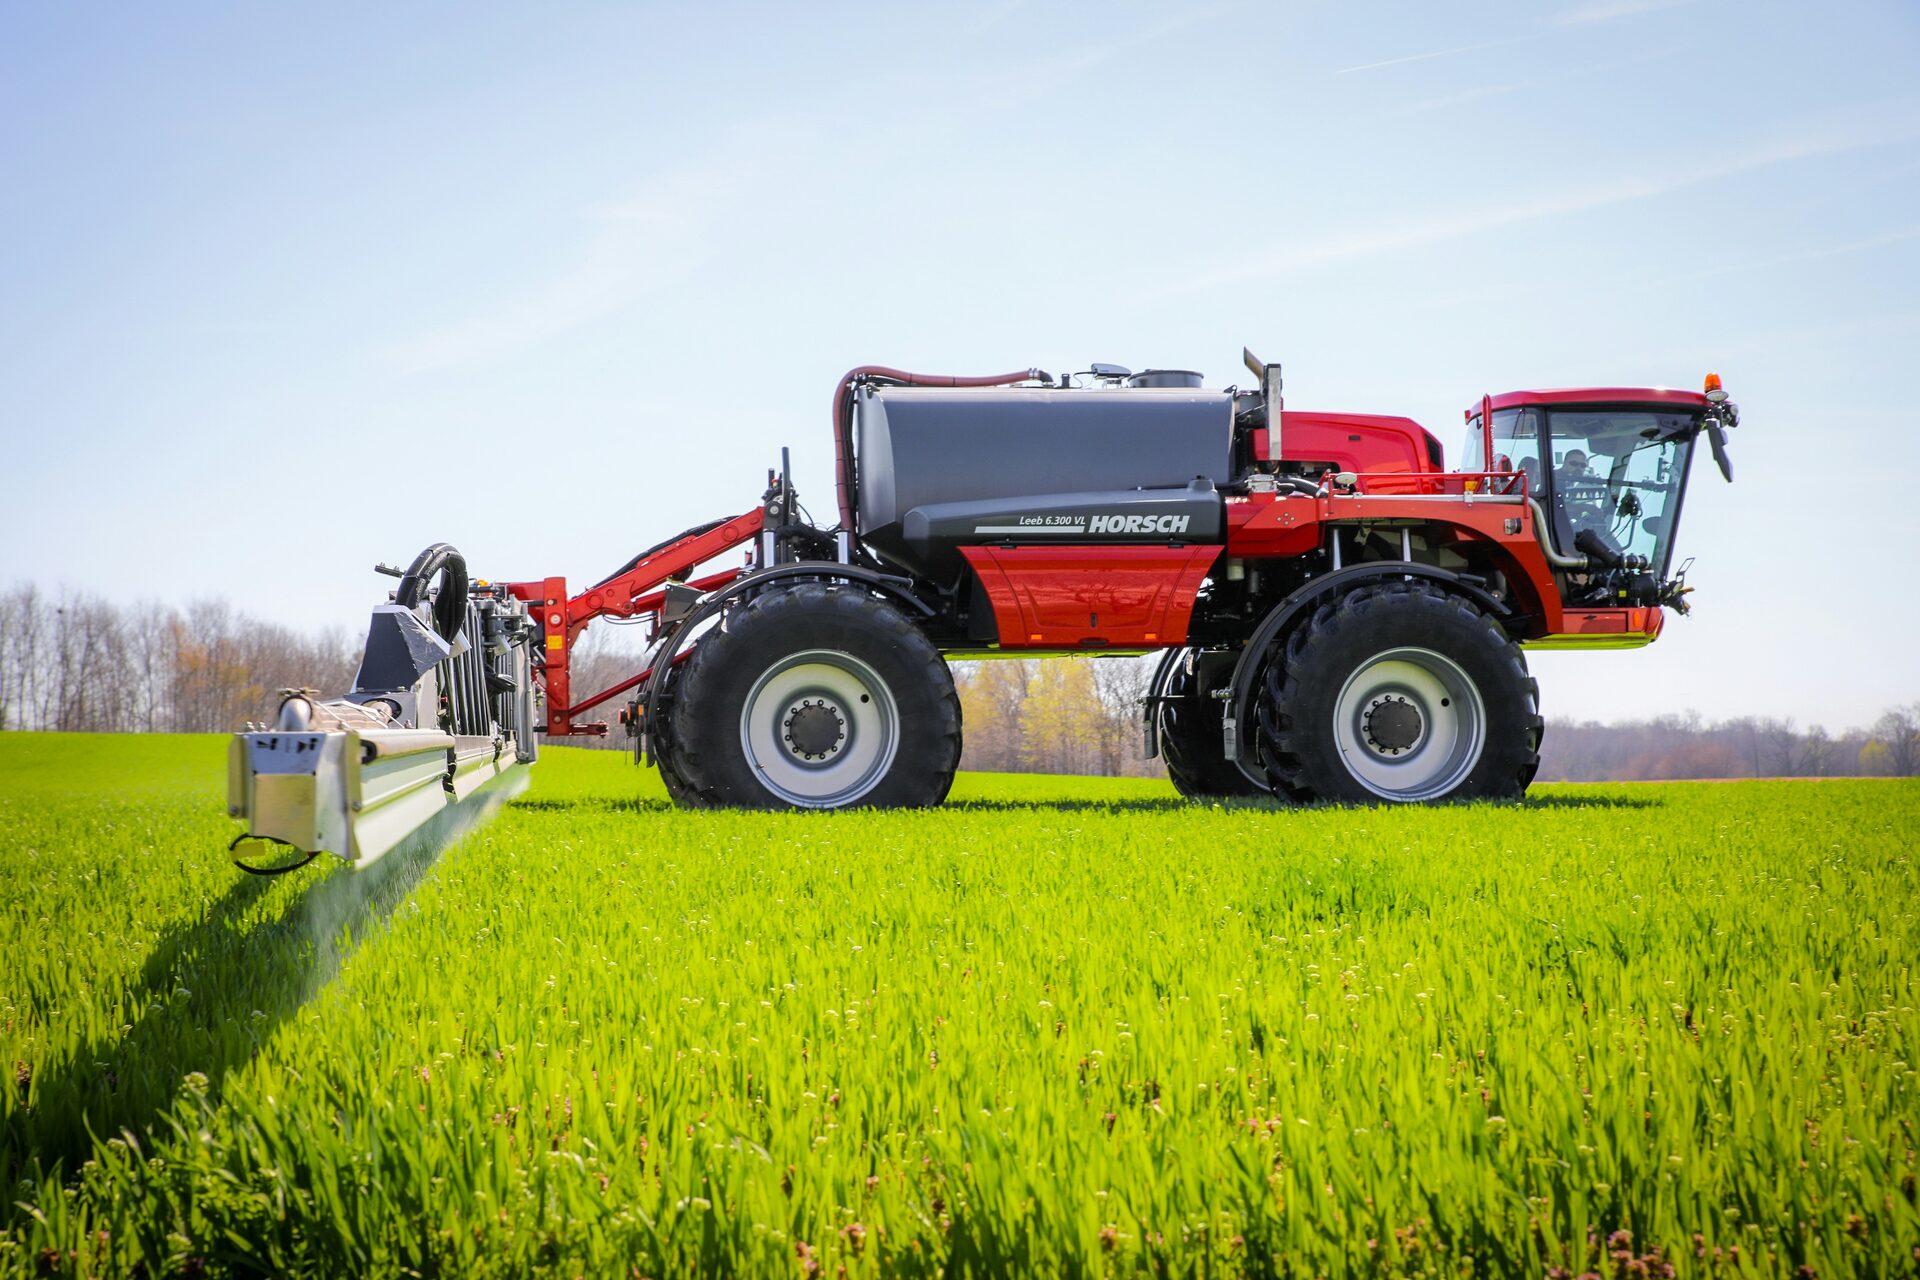
Few fields are even, yet a flat rate treats them as if they were. In the FarmDataViewer VRA Builder you turn what you know about a field into a rate per part of that field, check the map, and export it for your machine. The pictures on this page are the real builder, run on open data from a winter wheat field in Bulgaria.
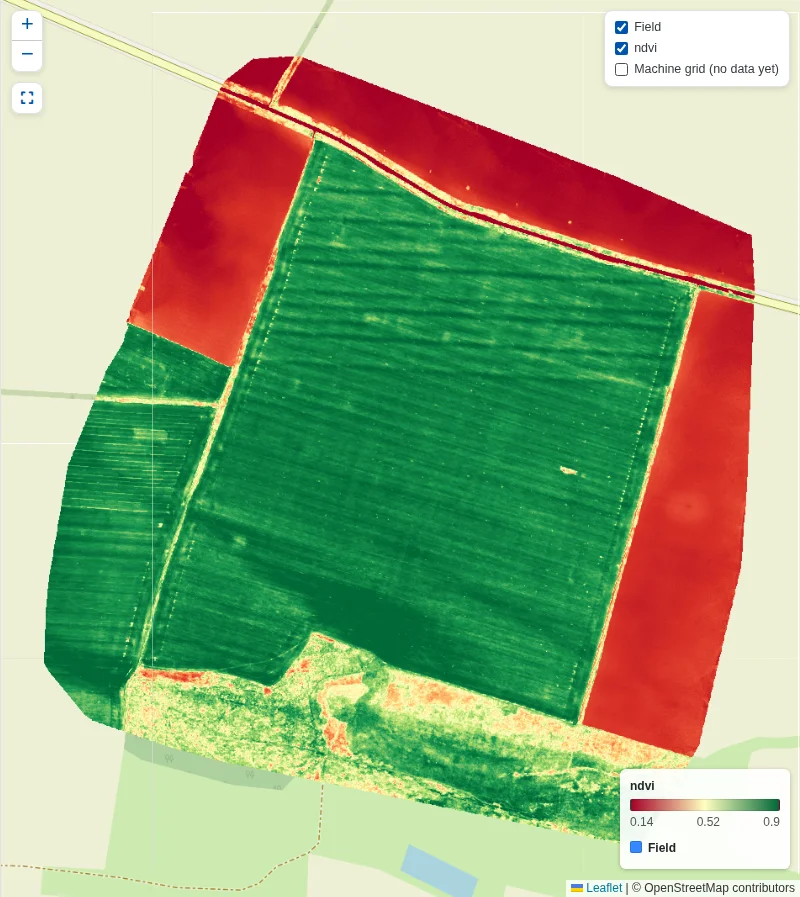
Data: Dimitrov et al. (2025), Zenodo, CC BY 4.0. NDVI calculated by us; prescription is our example. Base map: © OpenStreetMap contributors.
Start from what you know about the field
A good prescription starts with your own information, so the builder takes it from where you already have it. Use the satellite images of the field, the drone image you flew yourself, or a soil map, and combine them. In this example it is a drone flight over 86 ha of winter wheat on 21 March 2017, the time of year when the spring nitrogen decision is made. The stripes and the dark band in the south of the field are differences the rate can follow.
- Satellite crop indices, ready on each field
- Your own drone images and files
- Soil samples, soil maps and zone maps
- Observations and point measurements from the field
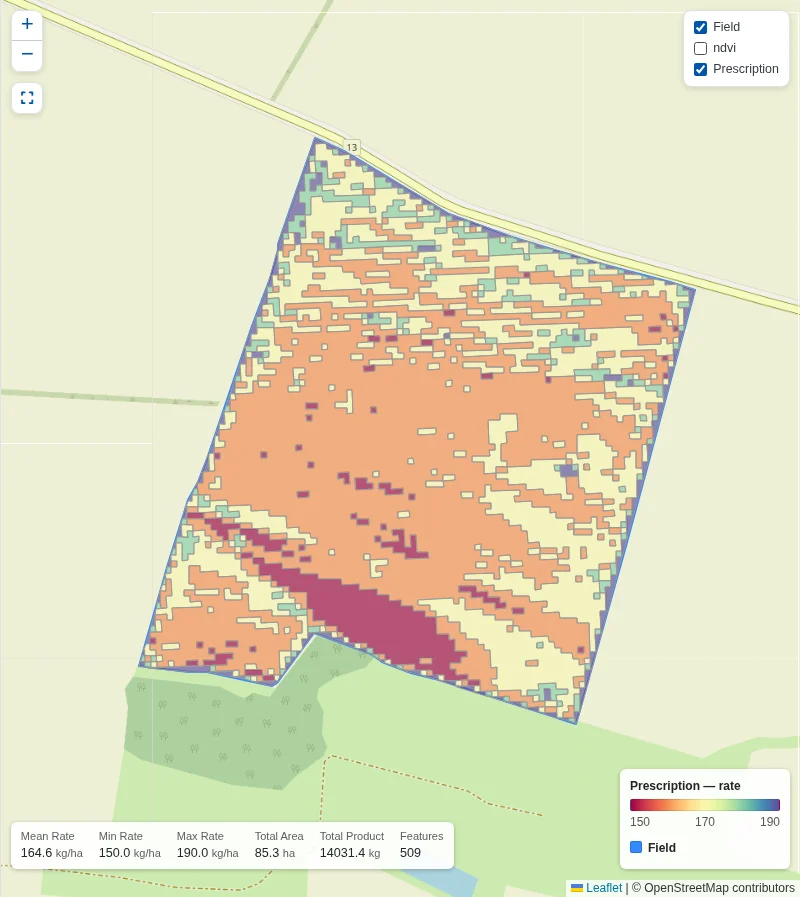
Data: Dimitrov et al. (2025), Zenodo, CC BY 4.0. NDVI calculated by us; prescription is our example. Base map: © OpenStreetMap contributors.
Your rule sets the rate
You decide how the field data becomes a dose: with a formula, with rules, with a table per zone, or with classes. Here the rule is simple: 420 - 300 × NDVI, so a thinner crop gets more. With limits of 150 and 190 kg/ha and five rates, the wheat field becomes this map of 85 ha. The rule and the limits are our example, not fertiliser advice: the agronomy stays yours.
- Formula, rules, lookup table or classes
- Minimum, maximum, step and number of rates
- A quick preview that follows each change
- Field mean, total area and total product at a glance
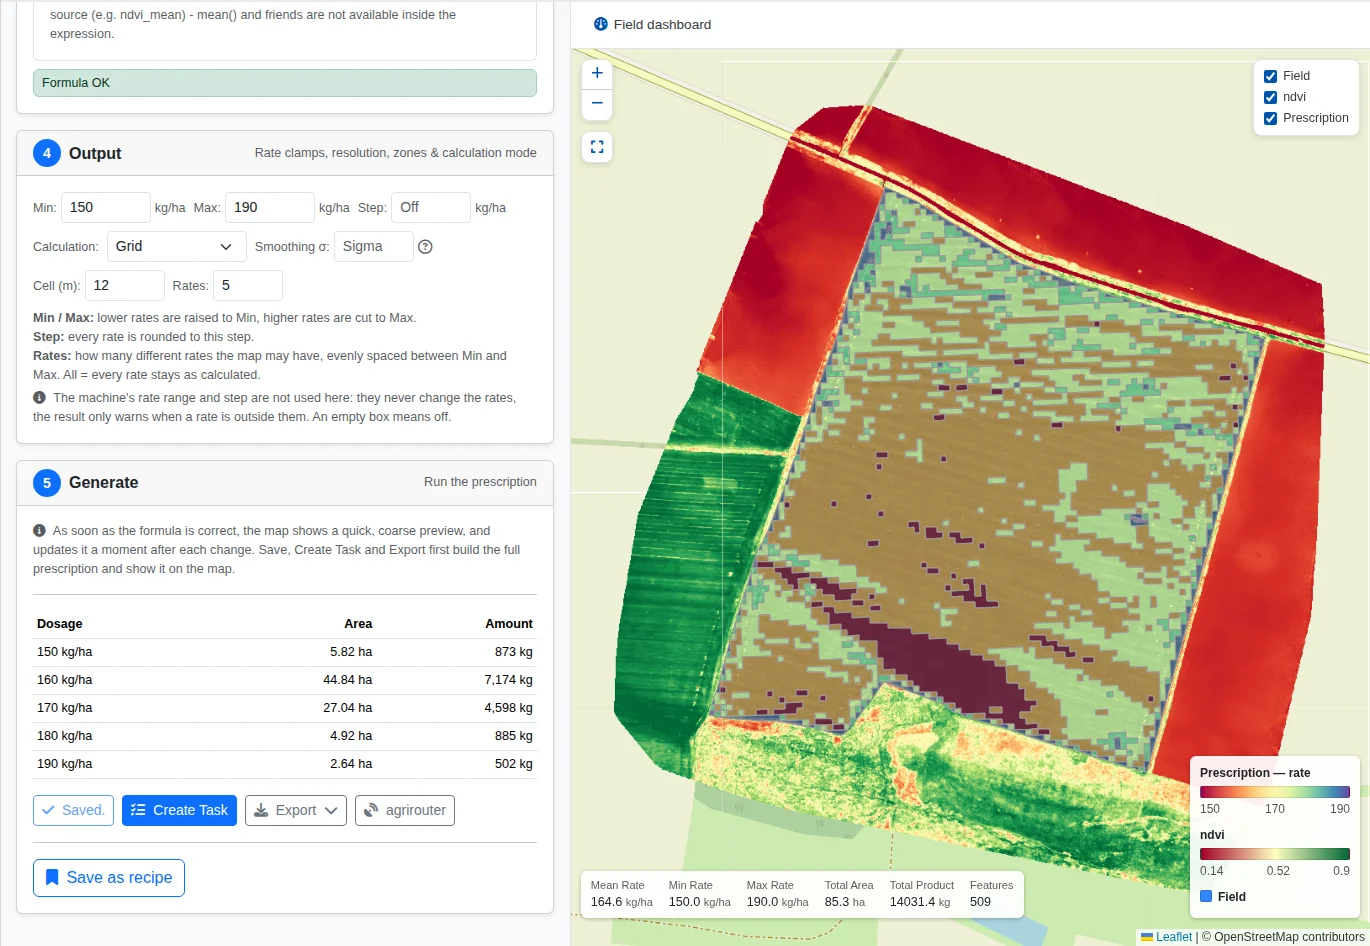
Data: Dimitrov et al. (2025), Zenodo, CC BY 4.0. NDVI calculated by us; prescription is our example. Base map: © OpenStreetMap contributors.
Made for the machine that drives it
Pick the machine and the map follows it: working width, sections, rate range and the task controller settings. The dosage table shows how much product each rate needs before anyone loads the spreader. In the example that is about 14 tonnes, of which 7.2 tonnes at 160 kg/ha. When a rate falls outside what the machine is set for, the builder warns you and leaves the choice to you.
- Export as ISOXML, Shapefile, GeoPackage or GeoJSON
- Grid or zones, as your machine prefers
- Driving direction along a heading or AB line
- Turn the map into a task for the team
Do it once, use it all season
Save it as a recipe
Keep a method you trust and load it on the next field, so the same reasoning applies across the farm.
Keep it with the field
Saved prescriptions stay on the field with their name, date and product, ready to reopen or export again.
Seed, lime and more
The same steps work for fertiliser, lime, seed, crop protection, manure and irrigation.
About the example data
The example uses field Unit 2 of season 2016-17 from an open dataset of winter wheat fields near Knezha, Bulgaria, published by Dimitrov et al. We have no connection with the authors. What we changed:
- We calculated NDVI as (NIR - Red) / (NIR + Red) from the drone bands of 21 March 2017 (file S16-17_U2_2017-03-21).
- We took the boundary of unit S16-17_U2 from the published shapefile and converted it to WGS 84.
- We made the prescription in the VRA Builder. The formula, rate limits, product and machine are ours and are not part of the dataset.
The rates are an illustration of the software, not a recommendation for this or any other field. The authors do not endorse FarmDataViewer.
Sources
- Dimitrov, P., Roumenina, E., Jelev, G., Filchev, L., Gikov, A., Kamenova, I., Ilieva, I., Ganeva, D., Kercheva, M., Banov, M., Krasteva, V., Kolchakov, V., Dimitrov, E., & Miteva, N. (2025). In-situ and UAV dataset with crop and soil parameters obtained from winter wheat fields (Version 1.0.0) [Data set]. Zenodo.https://doi.org/10.5281/zenodo.17475742. Licensed under CC BY 4.0.
- Dimitrov, P., Roumenina, E., Jelev, G., Filchev, L., Gikov, A., Kamenova, I., Ilieva, I., Ganeva, D., Kercheva, M., Banov, M., Krasteva, V., Kolchakov, V., Dimitrov, E., & Miteva, N. (2026). In Situ Crop and Soil Data and UAV Imagery from Winter Wheat Fields in a Bulgarian Site. Data, 11(2), 35.https://doi.org/10.3390/data11020035.