Farmers on the coastal soils of North Holland face a sharpening dilemma: drought in summer, water excess in winter, and salt water creeping up into the root zone. From 2022 to 2026, the Zoetwaterboeren project showed how a single farm can manage its own freshwater supply — and we built the dashboard and app that made it visible.
A complete freshwater system, made visible
Zoetwaterboeren was a four-year initiative led by Vertify and Broos Water, running from January 2022 until its closing event in June 2026 and demonstrated at Hoeve Lotmeer, the farm of Klaas Schenk in Anna Paulowna. The farm harvests drainage water, purifies it through sand and activated carbon, and infiltrates it into a freshwater bubble stored 20 to 28 metres underground — around 30,000 m³ a year — to drip-irrigate crops through the dry season. FarmDataViewer, our field-management platform, powered the custom dashboard and app that tied this system together, turning sensors, water levels and forecasts into one clear picture of the farm's water.
Daily insight, in your pocket
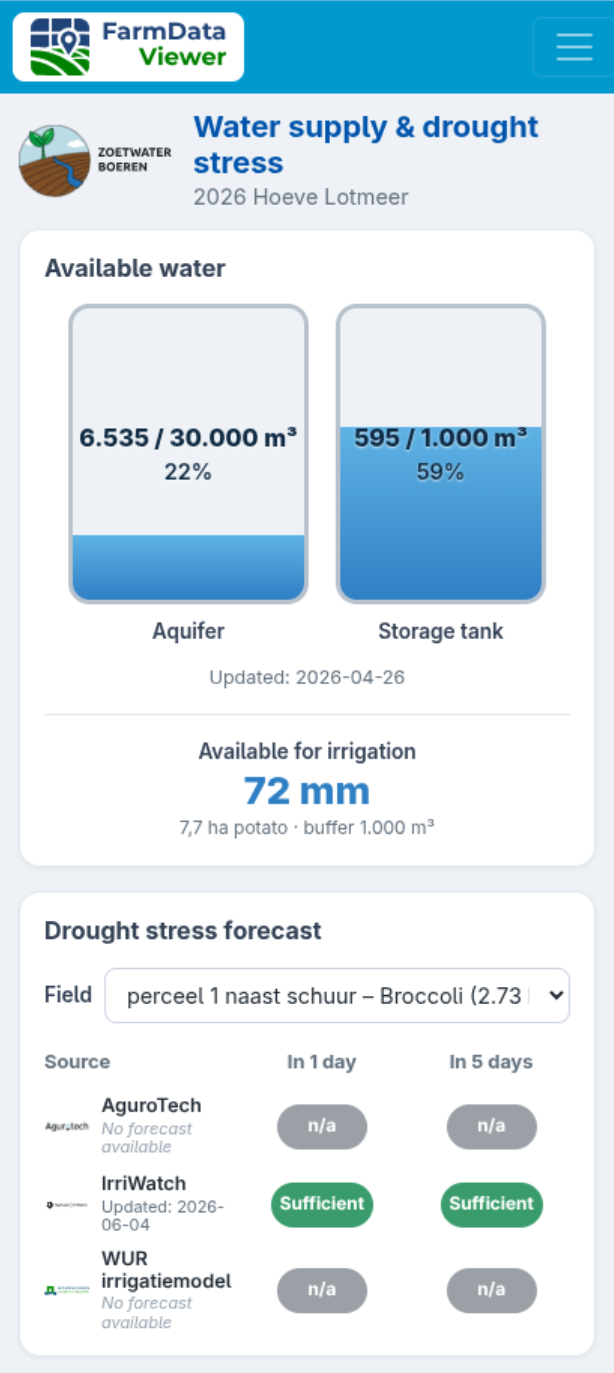
The mobile app is what the grower opens every day. At a glance it shows how much water is left in the aquifer and the storage tank, how much irrigation that buys per field, and a per-field drought-stress forecast that lines up several independent models side by side — enough to decide whether to irrigate today, without sitting down at a computer.
- Live aquifer and storage-tank levels at a glance
- Available irrigation volume per field, in millimetres
- Per-field drought-stress forecast from several independent models
- Built for a quick daily check, out in the field
Drill down on the web dashboard
When a closer look is needed, the web dashboard opens up the full picture. A field-by-field moisture map with toggleable layers — soil and elevation maps, live sensor feeds and irrigation advice from several models — sits beside a real-time cross-section of the storage system and per-field forecast charts. It is where the grower and advisors analyse trends, compare sources and understand why the numbers in the app look the way they do.
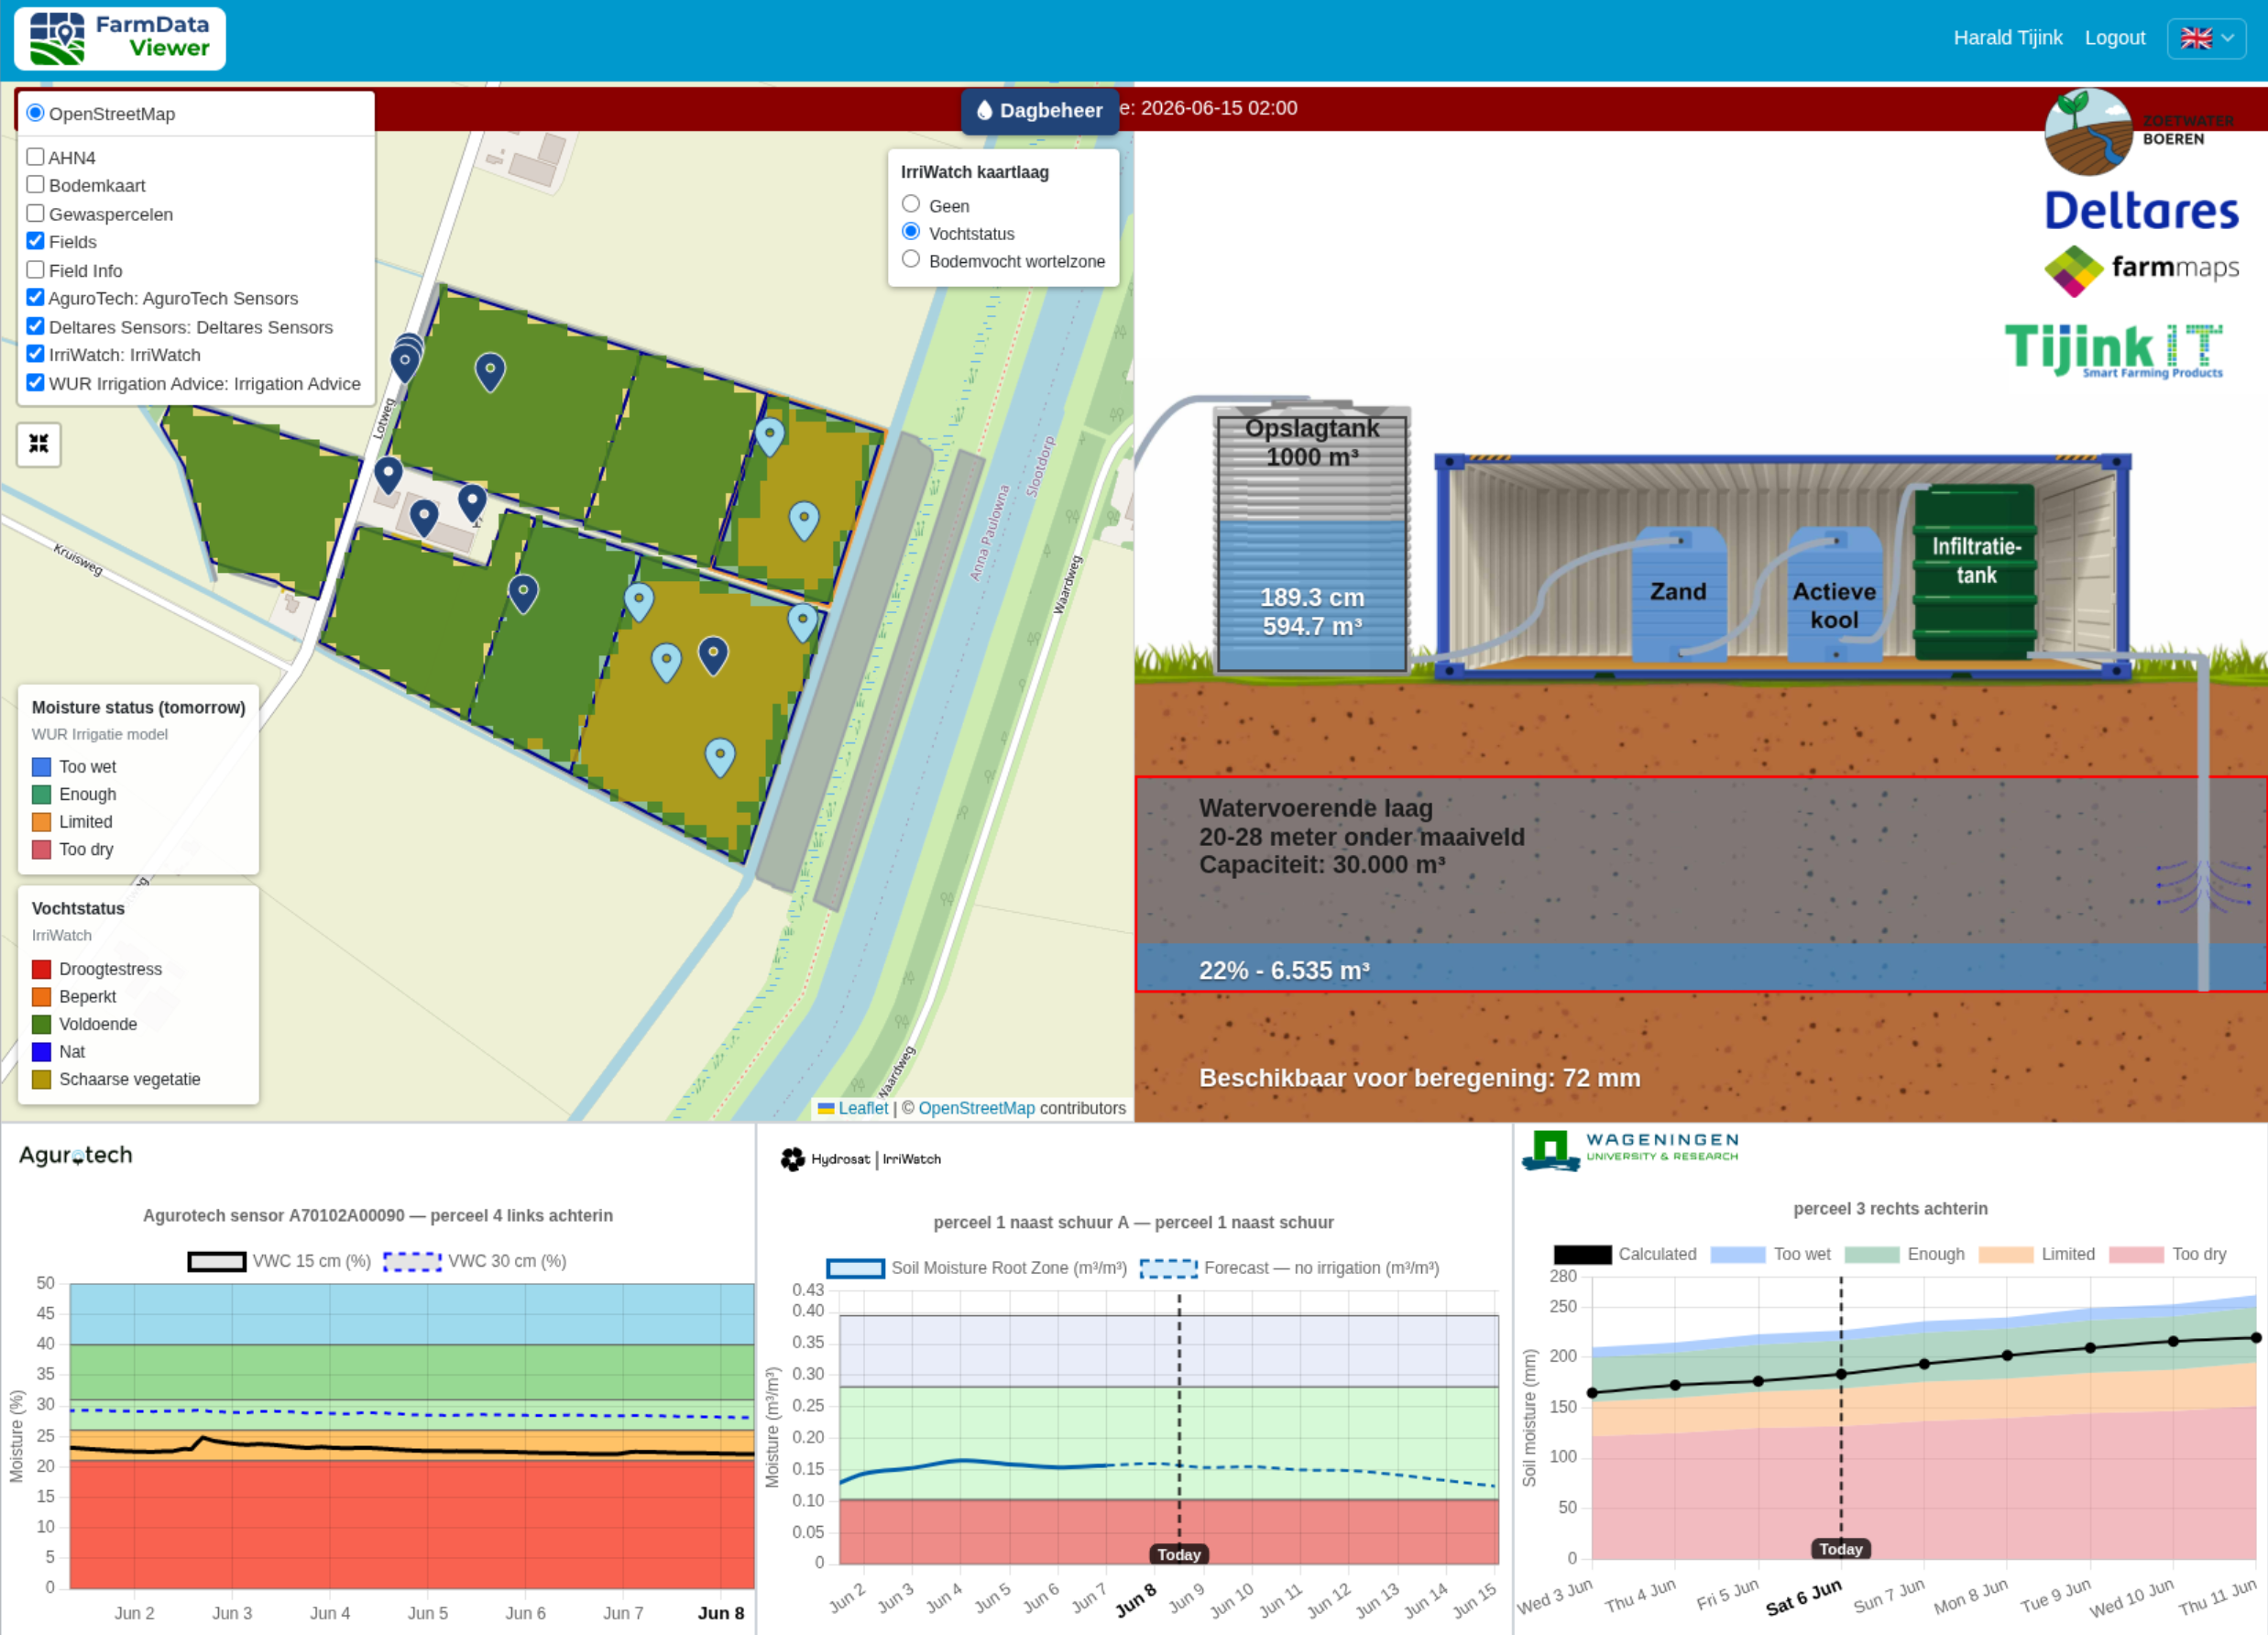 Click to view the full dashboard
 Built on FarmDataViewer
A mapping platform
Field boundaries, soil and elevation maps, sensor layers and public data (WMS, WMTS, PMTiles) — the mapping foundation was already there.
Observations & tasks
The platform's observation and task-tracking tools carried over unchanged, so field work and water management lived in one system.
Web and mobile
FarmDataViewer ships as both a web app and a mobile app, so the Zoetwaterboeren solution worked on every device from day one.
Extended for water
On that base we built the custom water-balance views, the storage-system diagram and the multi-model drought forecast, tailored to this project.
Part of a wider data ecosystem
FarmDataViewer was the window onto the data, not the only system involved. Behind the dashboard sits a chain of specialised services. Independent sensors and crop-water models each measure or predict one piece of the picture; FarmMaps collects and harmonises those feeds as a central data service layer; and FarmDataViewer reads from FarmMaps to bring everything together in a single, farmer-friendly view.
Keeping these roles separate is what makes the system robust: each source does what it does best, FarmMaps speaks one common language to all of them, and FarmDataViewer turns the result into something a grower can act on in seconds. Add a new sensor or model tomorrow, and the dashboard simply shows it.